Politicians are already ramping up for November 2024. From campaign ads to televised debates and townhalls, talking points around the economy are difficult to avoid. As you begin to hear the familiar refrains around job creation, the stock market, inflation, and gas prices, it’s worth taking a step back to ask: How much do elections really impact the stock market?
Performance prior to an election
First, the numbers:
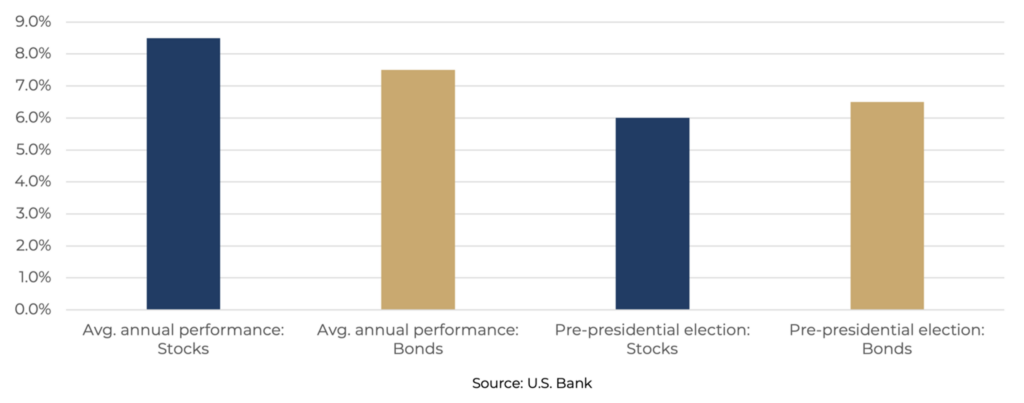
During any given one-year period, analysts at U.S. Bank found that stock indices showed gains of around 8.5%, and bond markets had returns of around 7.5%. But in the year leading up to a presidential election, the averages dipped to below 6% for equities and 6.5% for bonds.
There are multiple factors driving the market during any given pre-election year, so it’s hard to state with certainty what caused lower-than-average performance for stocks and bonds. However, traders and investors don’t like uncertainty.
As humans, we naturally resist change—in psychology, it’s referred to as familiarity bias. People show a default preference for what’s familiar. (In pop culture terms, “the devil you know.”) When there’s potential for major change on the horizon, like a shift in political power, people tend to delay major decisions, including big investments.
Performance after an election
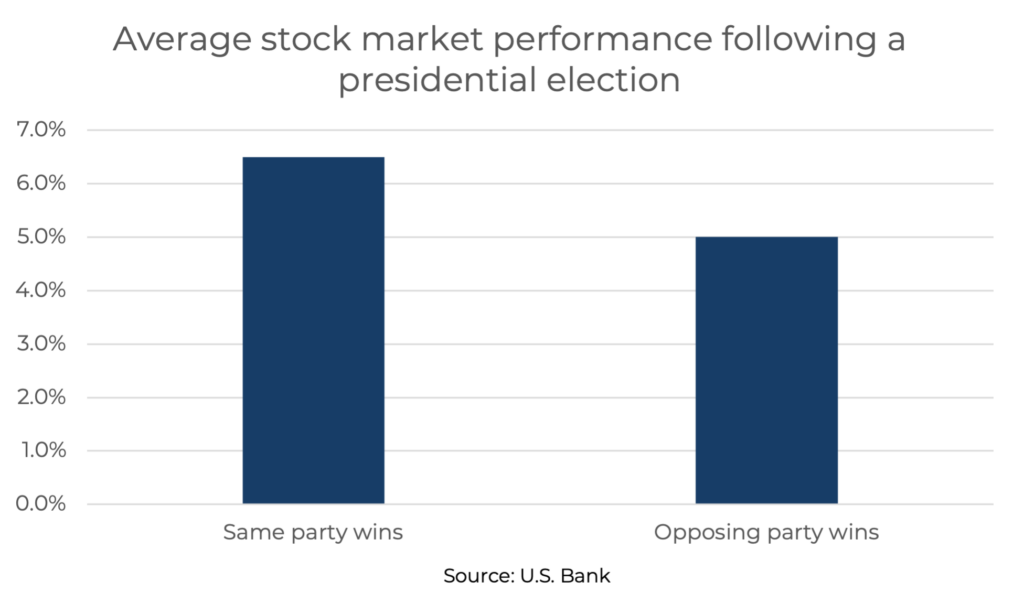
Many people assume that the market reacts differently depending on which party is in power (Democrat or Republican). In reality, the party itself matters less than the overall shift in power dynamics. In other words, whether we transition from one party to another or stick to the same one has more of an impact, statistically speaking.
In the same U.S. Bank study of market performance around elections, analysts found that when a president is reelected, or when his party retains power, the stock market returned 6.5% on average. When the opposing party wins the White House, the stock market returned just 5%.
Based on what we know about cognitive bias, this makes sense. Keeping the same political party in power means less change — and less change means less uncertainty to spook investors.
It’s worth noting that some short-term volatility has been recorded following elections, but volatility is primarily isolated to certain market sectors—think healthcare and energy (or any other industry impacted by a candidate’s major talking points).
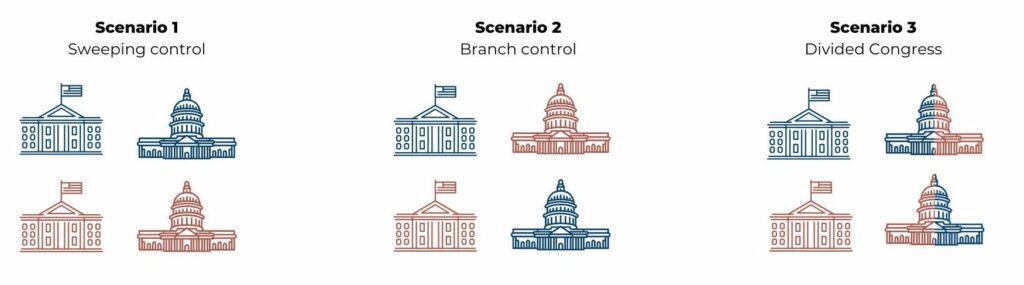
Divided government vs. sweeping control
Of course, these major elections aren’t just about the presidency, as it’s possible for Senate or House seats to flip as well.
This means that following every presidential election (and midterm election), we’re left with one of three scenarios:
Based on what we know about cognitive bias, this makes sense. Keeping the same political party in power means less change — and less change means less uncertainty to spook investors.
It’s worth noting that some short-term volatility has been recorded following elections, but volatility is primarily isolated to certain market sectors—think healthcare and energy (or any other industry impacted by a candidate’s major talking points).
Divided government vs. sweeping control
Of course, these major elections aren’t just about the presidency, as it’s possible for Senate or House seats to flip as well.
This means that following every presidential election (and midterm election), we’re left with one of three scenarios:
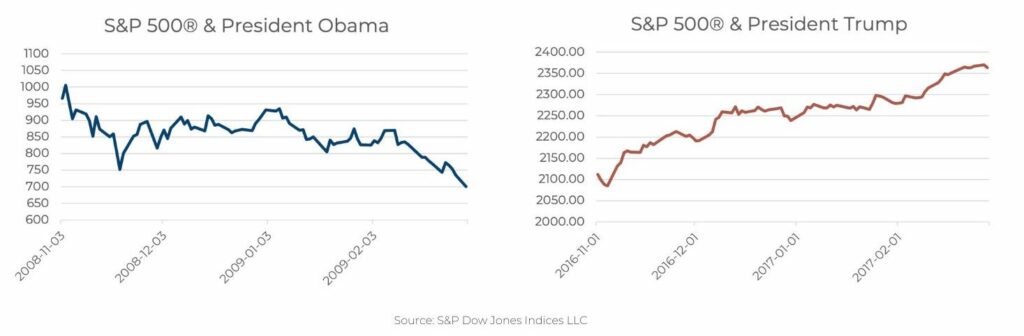
While you might conclude that this performance discrepancy between a Republican sweep and a Democratic sweep shows the market prefers the GOP, doing so would leave out a major outlying factor: 2008 was the height of the Financial Crisis. The S&P 500 bottomed in summer 2009, shortly after this window.
This is a prime example of how presidential elections may play a role in market movements, but they’re certainly not the only factor to consider.
Purple reigns
Below is a chart outlining how the S&P 500 has performed in recent history throughout various administrations.
Keep in mind: In the 90 years covered by this chart (1933-2023), the country experienced two world wars, conflicts in Korea and Vietnam, the Cold War, 9/11, and the Global War on Terror. It spans the recovery from the Great Depression through inflation in the 1970s, the Savings and Loan Crisis of the 80s, the dot-com bubble, the 2008 Financial Crisis, and COVID.
During these terms, presidents dealt with varied Congressional compositions. Alaska and Hawaii officially became states (and gained representatives). There were three impeachments and one close call.
Still, there were only two instances where the stock market lost value during a presidential term.
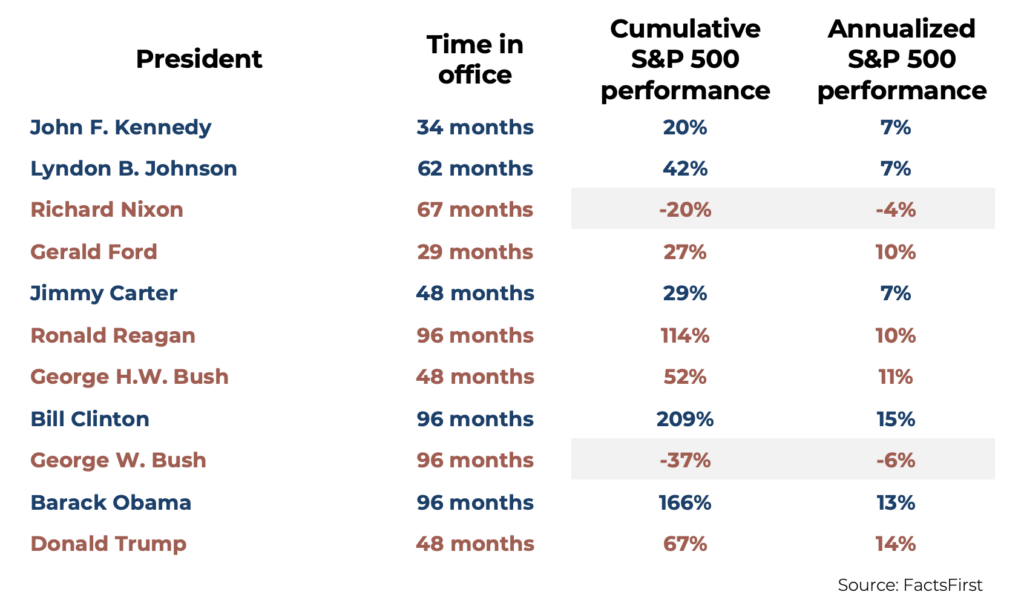
The biggest takeaway here is that no one political party in charge consistently leads to better market performance than another. As we can see above, the S&P 500 will always fluctuate in the short term and trend toward long-term growth.
Politics and your portfolio
At Quorum Private Wealth, we build our clients’ portfolios based on a long-term strategy—your financial plan is designed to outlast any single election cycle.
While the prevalence of politics and campaign ads may tempt you to scrutinize the market and economy, we find it’s more helpful to ignore the noise and focus on your personal portfolio and how it aligns to your long-term goals. Soon, this election cycle will be over, and the data shows that, despite the noise, the trend toward growth continues regardless of who’s in the White House.
Still, if you have specific questions about politics and your portfolio, schedule a call.
Read more:
What is the market?
Can you trust your financial advisor?
How to leverage the Estate Tax