
The 60/40 portfolio had the worst start to the year since 1932, and through the beginning of July, it’s down 18.44%.¹
What is going on here? Isn't the point of the 60/40 portfolio that when equities struggle, bonds will see inflows as investors flee risky investments, pushing bond prices up? Isn't that what "diversification" is all about?
This year is a historical anomaly when stocks and bonds struggle simultaneously. Spiking inflation has prompted an aggressive response from the Federal Reserve in raising rates, and bond yields have increased. At the same time, a strong labor market, persistent supply chain woes, and the ever-more-likely possibility of a recession are giving the equity markets a prolonged case of the jitters. Add in the ongoing war in Ukraine and heightened global uncertainty, and it's been a wild ride, mainly on the downslope.
Historical, yes – but not unexpected. The reason that the diversification of the 60/40 portfolio isn't working is that equities and bonds are no longer negatively correlated. They are currently moving in tandem. This has happened before – but nobody complains when equities and bonds both go up.
To get a better handle on what is going on – and what investors can do about it – let's review some principles of diversification.
The Classic: Don't Put All Your Eggs in One Basket
At its most basic, diversification means spreading assets out over various investment types. This happens at the asset class level – stocks, bonds, cash. It also occurs within asset classes. The basic premise is that different assets will perform differently in response to conditions affecting the entire market or at various points in the business cycle.For example, a well-diversified equity portfolio would take advantage of the following:
- Market capitalizations: Large, small, and mid-cap companies
- Geographies: Domestic vs. International and Developed vs. Emerging
- Industry Sectors: Defensive vs. Growth
And a bond portfolio would likely take advantage of differences in bond issuers, for example, government vs. corporates, credit quality, and duration, among other factors.
The Goal is to Lower the Level of Acceptable Risk for a Given Level of Return
Including assets with different risk profiles can lower overall portfolio risk while preserving return potential. Investing for the long-term means being sensitive to avoiding losses. Concentrating on a single or limited number of positions with a great deal of upside potential can result in outsize gains – but those can evaporate when market conditions change.Morningstar reports that over the last three years, of all stocks listed on the NYSE and the NASDAQ, 40% lost money (1655 out of 4155). At the same time, the Morningstar U.S. Equity Category comprising mutual funds and ETFs – which can include hundreds of individual stocks – only 0.7% lost money (15 funds out of 2239).²
Adding diversification by increasing the number of positions that can offset each other resulted in lowering the risk of loss.
Great, But Let’s Get Back to Correlation
What happens when market or economic circumstances pull the entire equity market down? Typically, bond prices increase in response to investor demand for less risky assets. That's not happening this time because the Fed is aggressively raising interest rates, pushing bond yields up and prices down (bond prices move inversely to their yields).This leaves investors with the worst of both worlds – increased volatility and lower returns.
With equities and bonds correlated to each other, investors seeking diversification are looking outside these asset classes and incorporating a broader spectrum of assets. There are several options to consider, and they fall into different classifications.
Alternative Investments Can Provide Lower Correlations
Real Estate: For many investors, their own home is often one of their larger assets. But adding other real estate, in the form of direct investment (purchasing an investment property) or investing through a private or public fund structure can diversify an investment portfolio.Private Assets: Private assets have lower correlations to publicly traded assets like stocks and bonds. They are not traded on exchanges and are less liquid. This means two things: returns are not as affected by overall market conditions, and they may offer a liquidity premium in the form of greater return potential or enhanced yield. They may also provide lower volatility.
• Private Equity investments are made in privately-held companies to improve and grow them, and then take them public.
• Private Credit investments are loans to privately held, non-investment grade, middle-market companies.
Hedge Funds: generally use a wide variety of strategies, with each fund designed to take advantage of a specific market opportunity.
Commodities are a Historical Inflation Hedge
Commodities are essentially the raw materials that power the economy. They include energy, foodstuffs, metals, and livestock. They have low correlations to stocks and bonds, and individual commodities classes are often not correlated to each other.Physical Assets Have Tangible Benefits
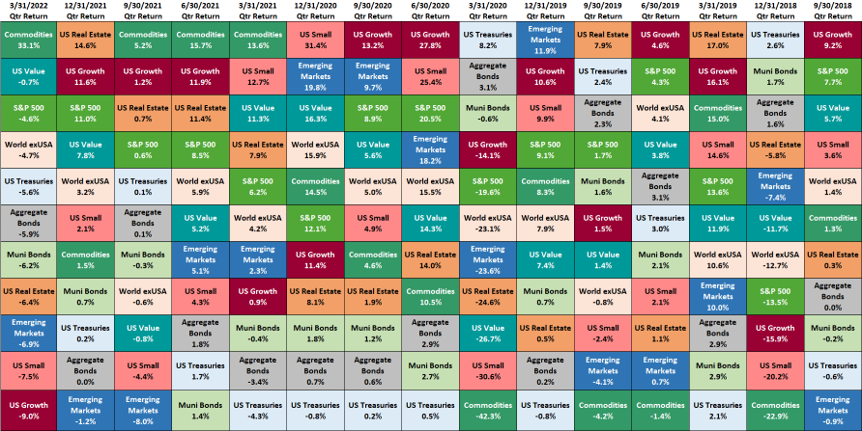
Art, homes, collectible cars, jewelry, and farmland are known as physical assets. They are generally not correlated to other types of investments, which can create diversification. However, the personal enjoyment derived from them is often enough for many people to justify inclusion in their portfolios. But they can also be a store of value, an inflation hedge, and a source of liquidity. Lending against tangible assets can be a way to access funds for other investments and monetize their value while retaining ownership.In closing, we’d like to leave you with a chart that graphically demonstrates the theory behind diversification. It’s called a “Quilt Chart” because it looks like an old-fashioned patchwork quilt. It presents quarterly performance by asset class, ranked each quarter from best to worst performer. It's easy to track a color across quarters and see how the asset performed – and most of them move up and down in a fairly broad range.
We take another meaning from it. We feel that "Quilt Chart" is a misnomer because the makers of those old quilts were very focused on creating patterns. As you can see, there is no pattern here. When we build a diversified portfolio, our clients' current lives and future goals are the only pattern that matters. That's what guides our development of an investment plan and the deployment of an asset allocation.
1. PortfoliosLab.com, using 60% Vanguard Total Stock Market ETF and 40% Vanguard Total Bond Market ETF.
2. Morningstar as of 5/21/2022.