A note on interest rates
Let’s look briefly at how various interest rates are determined. In the United States, it all starts with the Federal Funds Rate (Fed Funds Rate). When you hear that the Federal Reserve raised rates, this is the rate they raised.
So what is the Fed Funds Rate?
Banks must have a certain amount of cash on hand each night, per regulators. But since cash in reserve isn’t generating income for the bank, the banks often try not to keep much more than required. Sometimes, they may have less than required, in which case, banks might borrow from each other or from the Fed’s overnight lending window. The Fed Funds Rate is the interest charged on these overnight loans. As of April 2023, the target Fed Funds Rate was 4.75-5%.
Most interest rates are based on this core lending rate.
What is the yield curve?
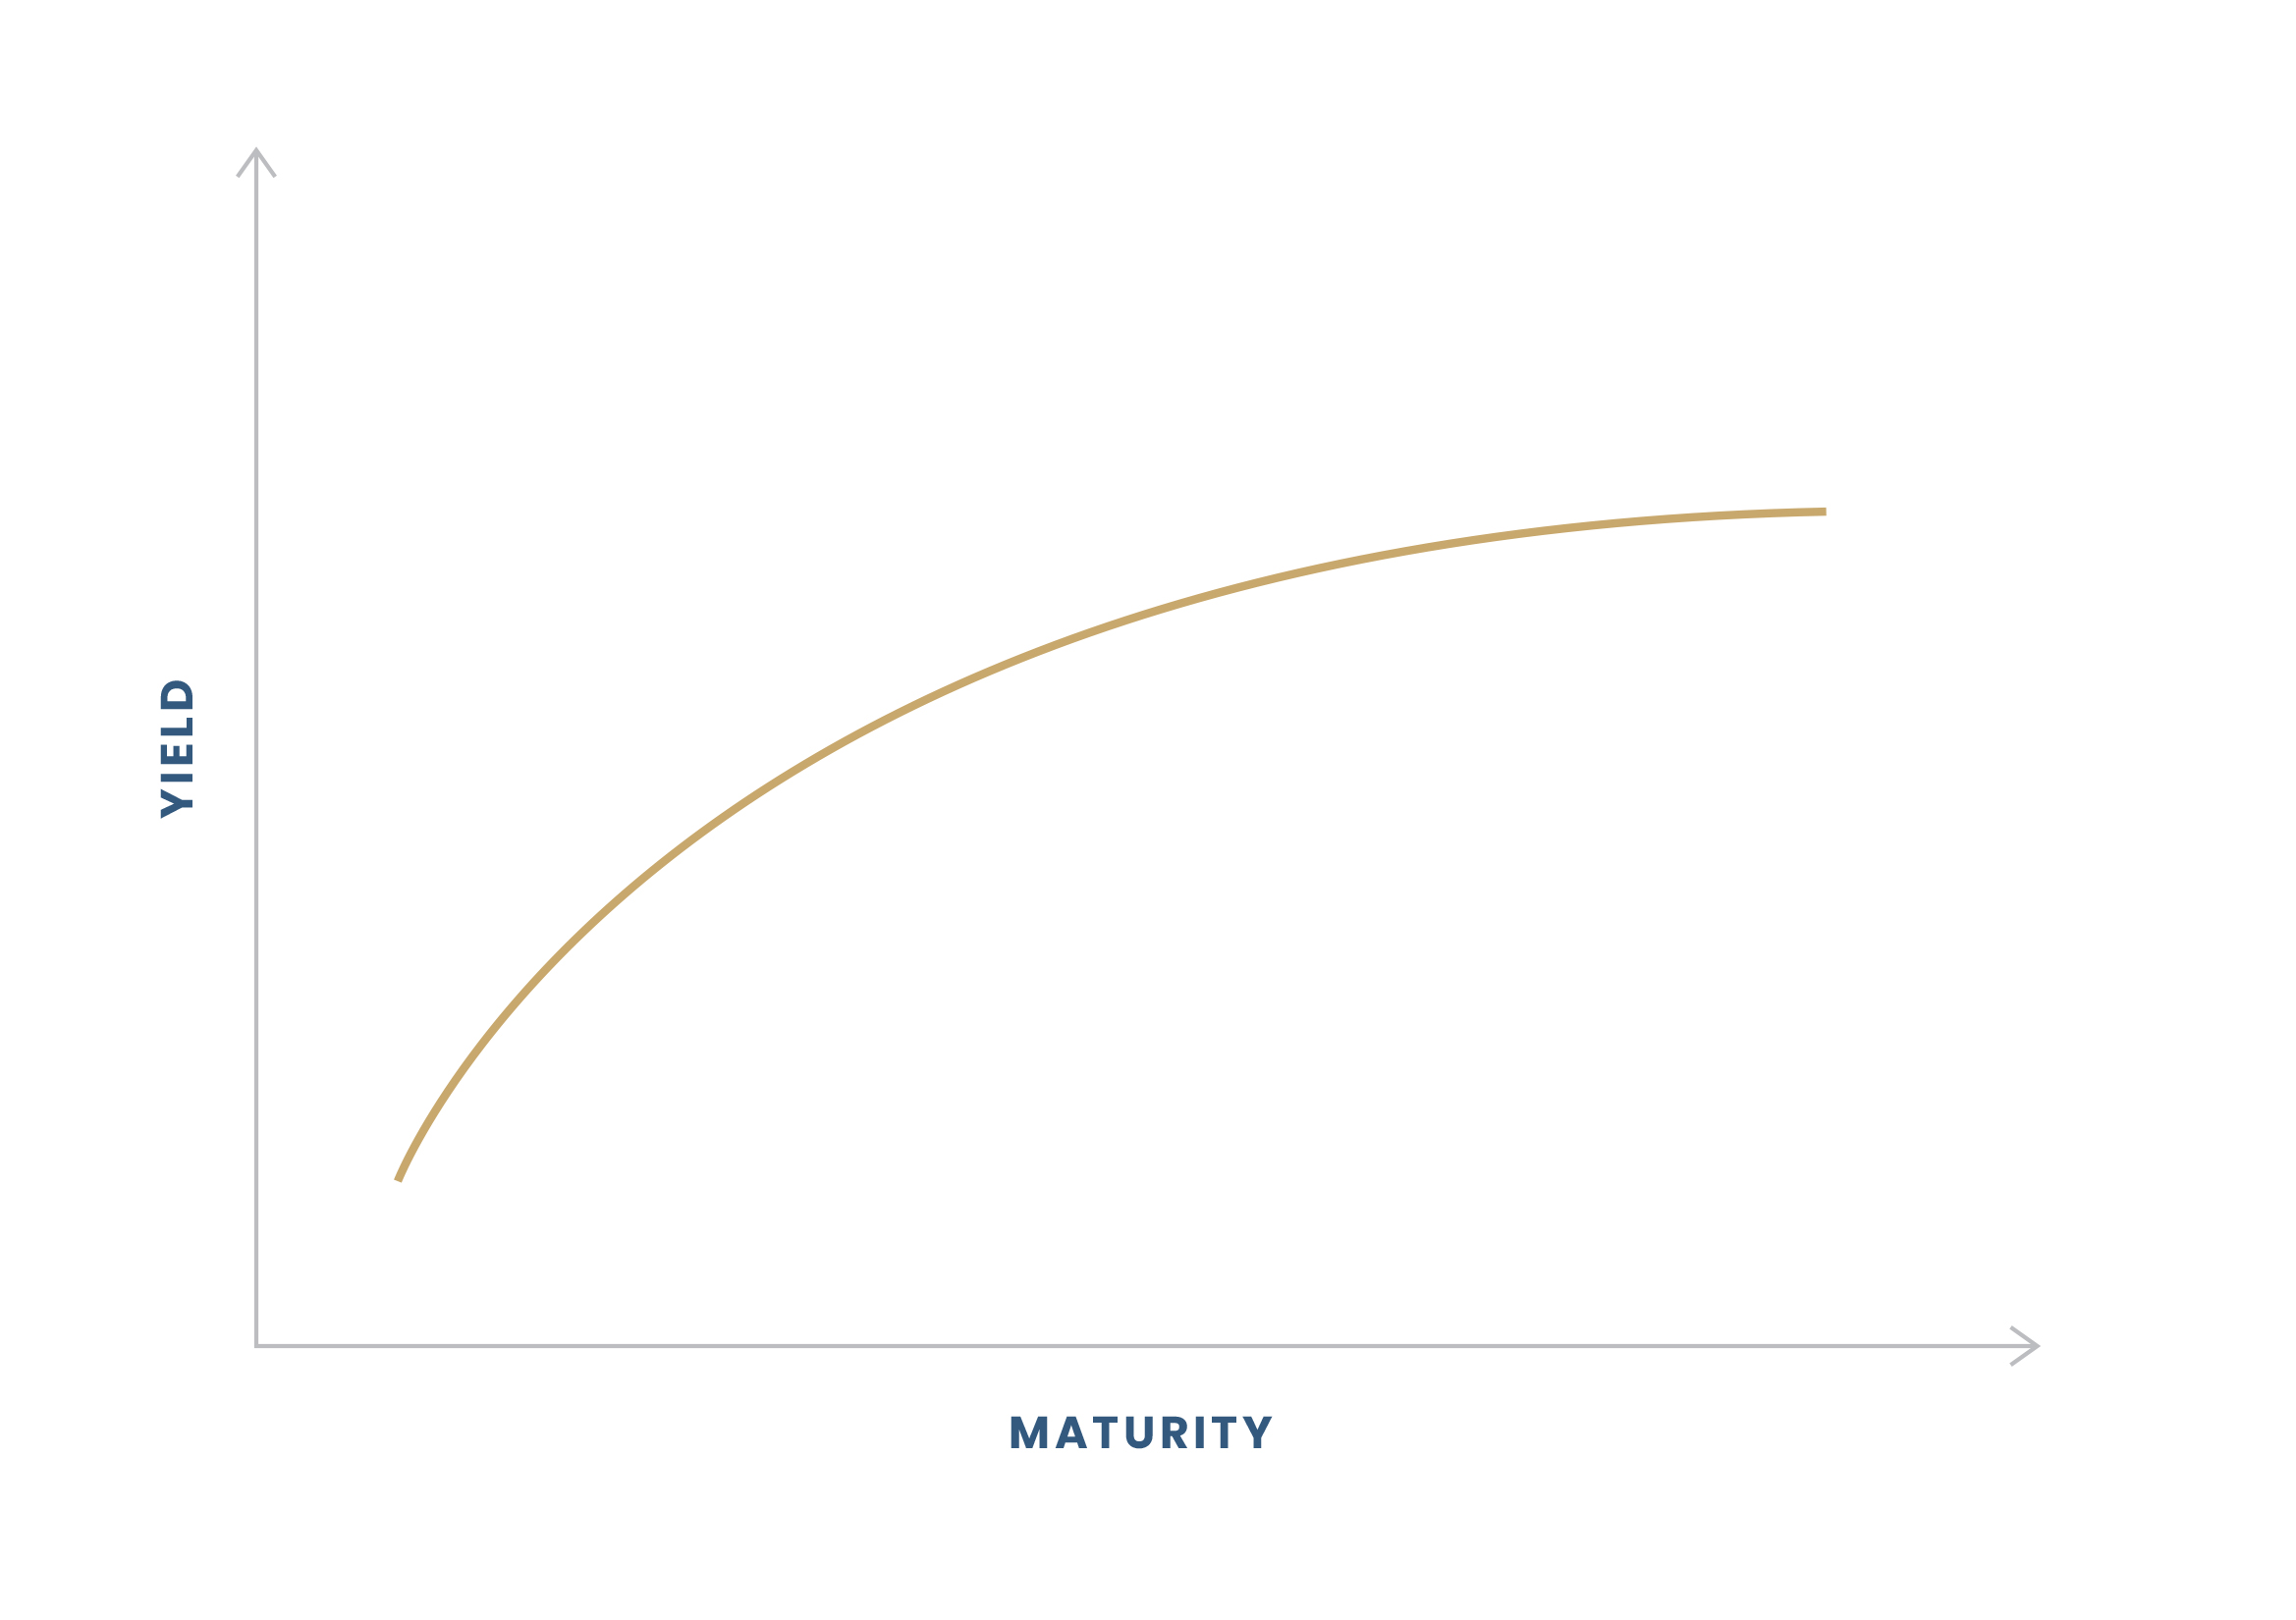
Most of the time, shorter-term loans are considered less risky than long-term loans and come with a lower interest rate. As the duration increases—the interest generally increases. In other words, the yield increases.
At least, that’s how it works during normal economic circumstances. A classic yield curve looks like this:
Why the yield curve matters
Yield on fixed income investments tends to be closely linked to interest rates, since bonds are essentially loans. Both matter to your overall financial picture: The yield on fixed income investments may impact your portfolio while changing interest rates may simultaneously impact other areas of your finances.
Yield and interest rates tend to be connected in material ways as well. Government-issued bonds (Treasuries) tend to be the benchmark lenders use for loans. For instance, a bank might use the 10- or 30-year Treasury yield as a starting point to calculate the mortgage rate on a 30-year fixed rate mortgage.
You likely expect a 30-year mortgage to come with higher rates than a 15-year mortgage for all of the reasons we’ve laid out so far. This reflects a normal yield curve.
Inverted yield curves
Every once in a while, the yield curve inverts. This generally happens when the Fed begins hiking rates. As we mentioned at the beginning of this article, rate hikes start at the shortest end of the spectrum: overnight lending.
The way rate increases trickle out to longer-term debt isn’t always predictable. If traders think that interest rates are going to come down in the future, they likely don’t want to be locked into higher rates for a long time period.
This can create a situation where short-term debt, the kind of debt that is viewed as less risky, pays a higher yield than longer-term debt. So-called cash-equivalent products (highly liquid products with very short durations) may pay higher yields than more traditional investments, like 10-year Treasuries. An inverted yield curve looks like this:
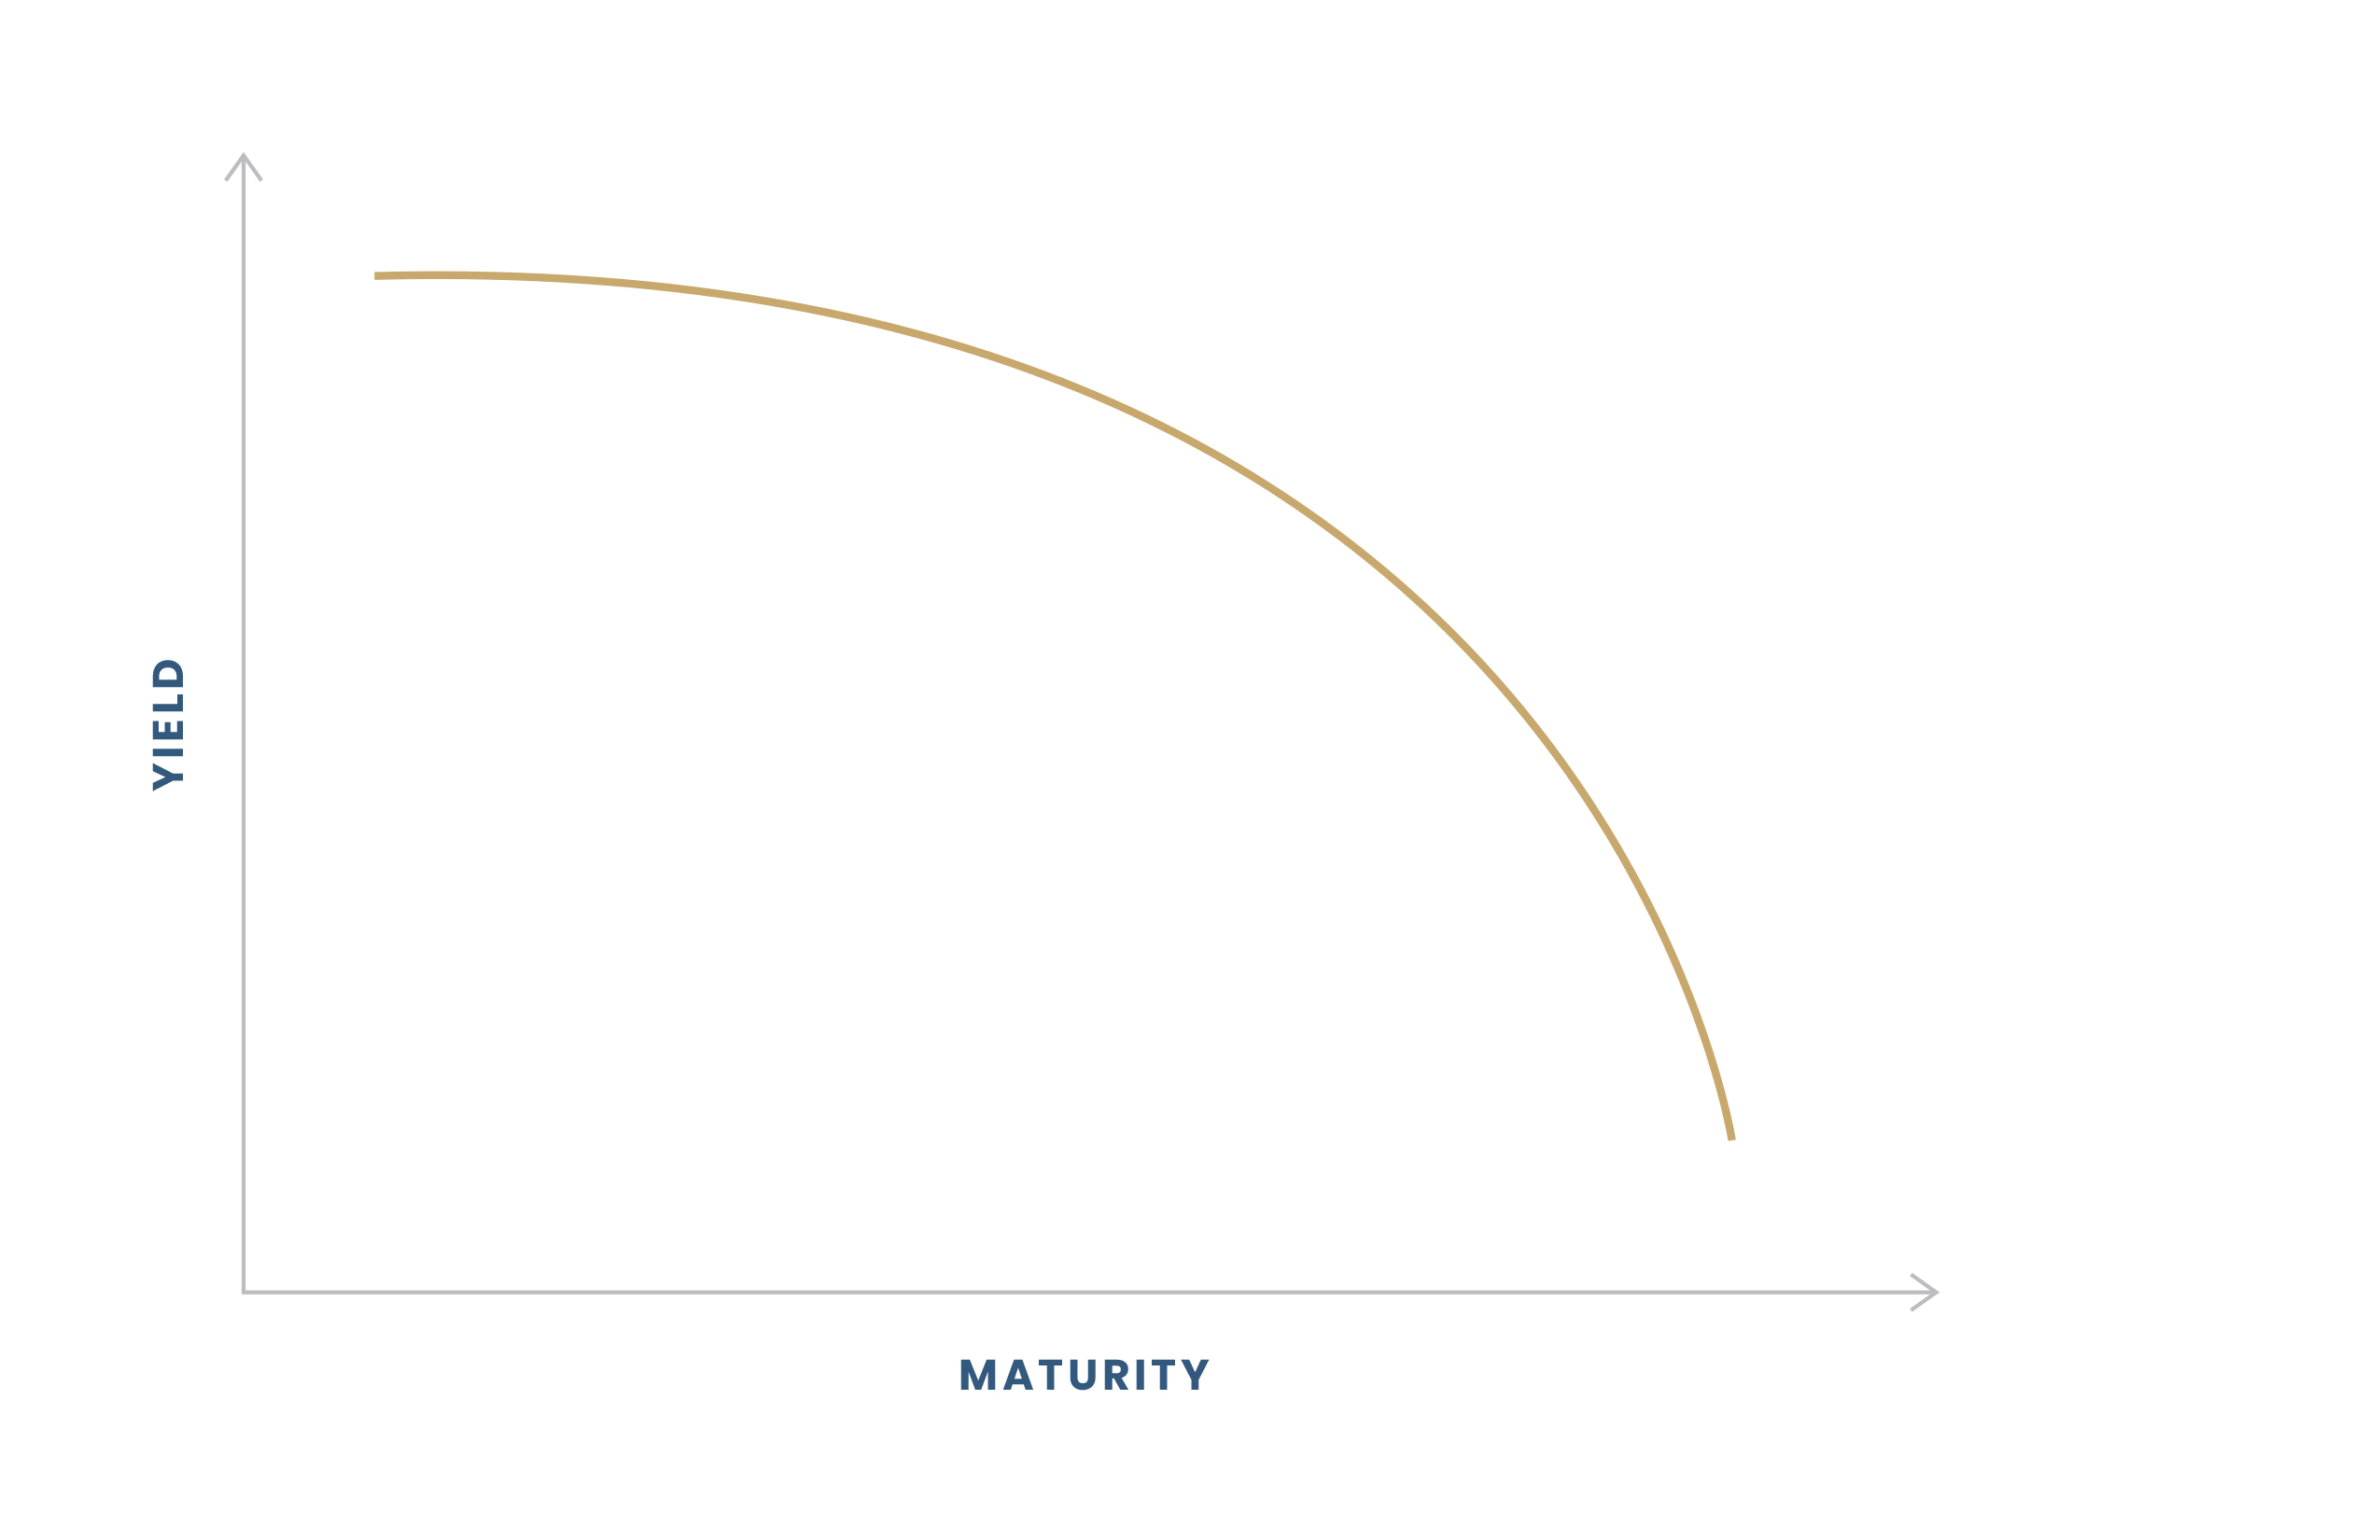
While that may sound promising, there’s a catch. Inverted yield curves tend to signal economic trouble, such as a recession. But while inverted yield curves are often a good predictor of economic uncertainty, they can’t predict the severity, duration, or timing of a potential downturn.
Consider this: The yield curve inverted in 2006, a full three years before the economy officially entered a recession in 2009, following the Financial Crisis. Another significant yield curve inversion? The late 1970s when Paul Volcker’s Fed raised rates aggressively to combat inflation. In spring 2022, the yield curve inverted and by early 2023, was more steeply inverted than during Volcker’s tenure.
How to invest when the yield curve inverts
At Quorum Private Wealth, we think it’s important to pay attention to key economic indicators, like the yield curve. It shows how traders, investors, and bankers are thinking about the economy over the next 30 or so years. Still, it’s important not to get too wrapped up in the details. We remain focused on our clients’ long-term goals and building diverse portfolios tailored to both economic circumstances and client needs. If you have questions about the yield curve, interest rates, or cash equivalents, reach out.